By Blerim Abedini, ISSD-North Macedonia
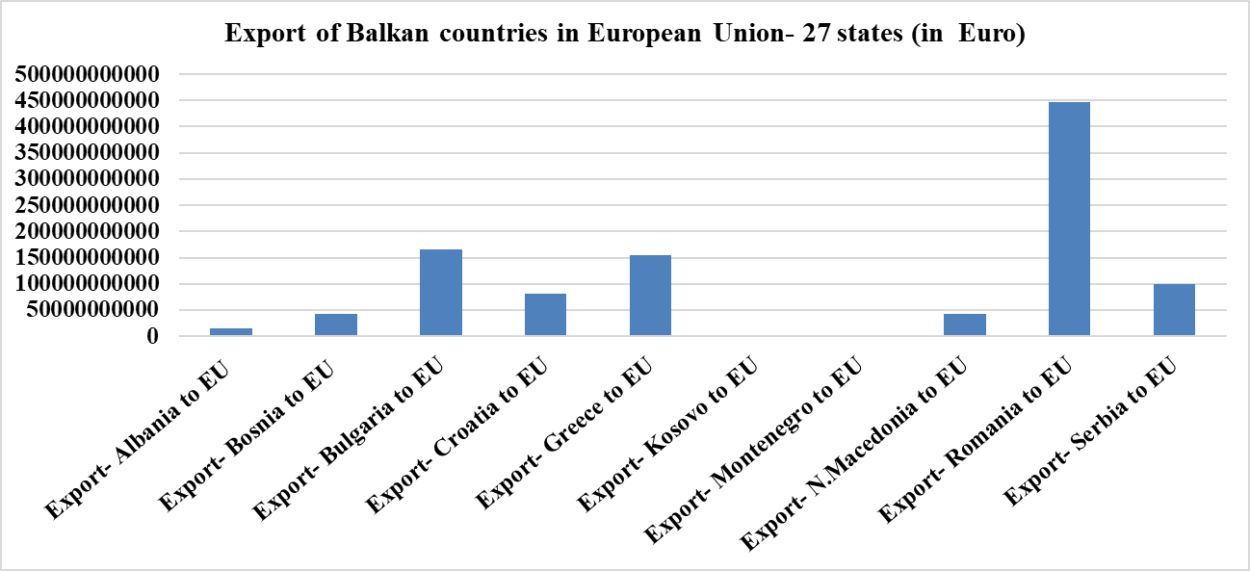
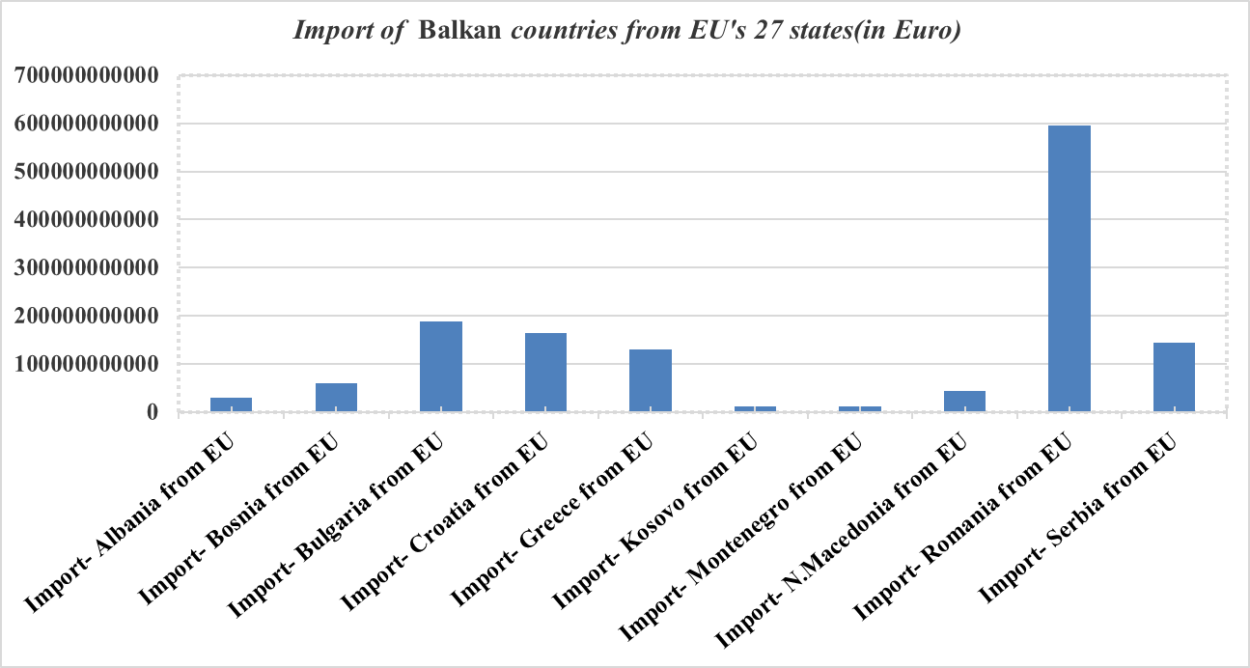
Trade differences are indicators for progress change attributed to member states of the European Union as are Bulgaria, Greece, Romania, and Croatia. Other non-EU countries in the Balkans have low trade exchanges with the EU except Serbia. Trade exchange data obtain a period of time from 2010 until 2021 year.
| Export- Albania to EU ( in euro ) | 15.511.045.615 |
| Export- Bosnia to EU | 41.851.289.433 |
| Export- Bulgaria to EU | 166.408.145.284 |
| Export- Croatia to EU | 81.488.213.731 |
| Export- Greece to EU | 155.039.123.733 |
| Export- Kosovo to EU | 1.531.772.660 |
| Export- Montenegro to EU | 2.444.472.149 |
| Export- N. Macedonia to EU | 42.896.611.101 |
| Export- Romania to EU | 446.307.843.381 |
| Export- Serbia to EU | 100.383.596.445 |

| Import- Albania from EU ( in euro ) | 30.289.475.171 |
| Import- Bosnia from EU | 59.319.506.218 |
| Import- Bulgaria from EU | 188.111.307.763 |
| Import- Croatia from EU | 164.404.718.255 |
| Import- Greece from EU | 129.898.601.002 |
| Import- Kosovo from EU | 11.132.881.531 |
| Import- Montenegro from EU | 11.619.698.788 |
| Import- N. Macedonia from EU | 43.612.450.322 |
| Import- Romania from EU | 595.323.231.015 |
| Import- Serbia from EU | 144.598.316.066 |

Source:
The Market Access Database, the EU Trade Helpdesk, Statistics page | Access2Markets (europa.eu)
Comments are closed, but trackbacks and pingbacks are open.